What is cache hit ratio?
Cache hit ratio is the percentage of HTTP requests served directly from cache, without hitting your origin server. A hit ratio of 90% means 9 out of 10 requests never reach your PHP application or database.
Hit ratio = (cache hits) / (cache hits + cache misses) × 100A high hit ratio means:
- Faster responses for users (cached responses are 10–100× faster than origin responses)
- Lower server load (fewer requests reach PHP/database)
- Better Core Web Vitals scores (TTFB is dominated by origin response time on misses)
Measuring cache hit ratio by stack
Cloudflare
The easiest place to start. In the Cloudflare dashboard:
- Go to Caching → Cache Analytics (or Analytics & Logs → Traffic)
- Look at the cache status breakdown (hit / miss / expired …)
Cloudflare shows requests split into: hit, miss, expired, bypass, revalidated, dynamic.
For a rough hit ratio: hit / (hit + miss + expired). Ignore bypass (requests configured to skip cache) and dynamic (Cloudflare Workers or API responses).
Via the API (the legacy Zone Analytics endpoint was sunset in 2020 — use the GraphQL Analytics API):
SINCE=$(date -u -d '7 days ago' +%Y-%m-%d)   # macOS: date -u -v-7d +%Y-%m-%d
curl https://api.cloudflare.com/client/v4/graphql \
  -H "Authorization: Bearer $CF_TOKEN" -H "Content-Type: application/json" \
  -d '{"query":"query($zone:String!){viewer{zones(filter:{zoneTag:$zone}){httpRequests1dGroups(limit:7,filter:{date_geq:\"'"$SINCE"'\"}){sum{requests cachedRequests}}}}}","variables":{"zone":"'"$ZONE_ID"'"}}' \
  | jq '[.data.viewer.zones[0].httpRequests1dGroups[].sum]
        | {cached:(map(.cachedRequests)|add), total:(map(.requests)|add)}
        | {cached, total, ratio:(.cached/.total*100)}'
Varnish
# Live stats (refreshed every second)
varnishstat -f MAIN.cache_hit -f MAIN.cache_miss

# One-time snapshot with computed ratio
varnishstat -1 -f MAIN.cache_hit -f MAIN.cache_miss | awk '
  /cache_hit/  { hit  = $2 }
  /cache_miss/ { miss = $2 }
  END { printf "Hit: %d  Miss: %d  Ratio: %.1f%%\n", hit, miss, hit/(hit+miss)*100 }
'
For time-windowed stats, use varnishlog with vsl-query or set up a Prometheus + Varnish exporter.
Nginx (proxy_cache)
Add these variables to your access log format:
log_format cache_status '$remote_addr - $upstream_cache_status '
                        '"$request" $status $body_bytes_sent';
access_log /var/log/nginx/cache.log cache_status;
$upstream_cache_status returns HIT, MISS, EXPIRED, BYPASS, STALE, or UPDATING.
# Tally cache statuses across the log
awk '{print $3}' /var/log/nginx/cache.log | sort | uniq -c | sort -rn
# Then: HIT / (HIT + MISS + EXPIRED) × 100
WP Rocket / LiteSpeed Cache
You can detect these plugins per response:
- WP Rocket: no cache header by default — check the end of the HTML source for the footprint comment
<!-- This website is like a Rocket, isn't it? Performance optimized by WP Rocket... - Debug: cached@<timestamp> --> - LiteSpeed:
X-LiteSpeed-Cache: hit
For aggregate stats, you need either server-level logging (Nginx/Apache) or a plugin like Query Monitor that shows cache status per request.
Google Search Console (for SEO impact)
Search Console doesn't show cache hit ratios, but it shows the consequences of a low one. In Core Web Vitals:
- A high TTFB (Time to First Byte) for crawled pages usually indicates cold cache hits
- Pages with poor LCP scores often correlate with uncached origin responses
Cross-reference your cache flush events (deploys, plugin updates) with dips in Core Web Vitals scores in Search Console to see the SEO impact of cold cache periods.
What numbers to aim for
| Hit ratio | Assessment |
|---|---|
| > 90% | Healthy: most visitors get cached responses |
| 70–90% | Acceptable: room for improvement, especially for high-traffic pages |
| 50–70% | Low: investigate TTL settings and purge frequency |
| < 50% | Critical: significant performance and cost impact |
Common causes of low hit ratio
1. Too-short TTL: If your Cache-Control: max-age is 60 seconds, pages expire before they're warmed by organic traffic. Extend TTL to 3600–86400 seconds for mostly-static content.
2. Bypass rules that are too broad: Cache-Control: no-cache or no-store on pages that don't need it. Check if your CMS or framework adds these headers by default.
3. Excessive purging: WooCommerce stores that purge on every stock change can flush their cache hundreds of times per day. Throttle or debounce purge events.
4. Query string variations: example.com/page?ref=newsletter and example.com/page?ref=twitter are treated as separate URLs by most caches. Normalize query strings in your cache configuration to avoid cache fragmentation.
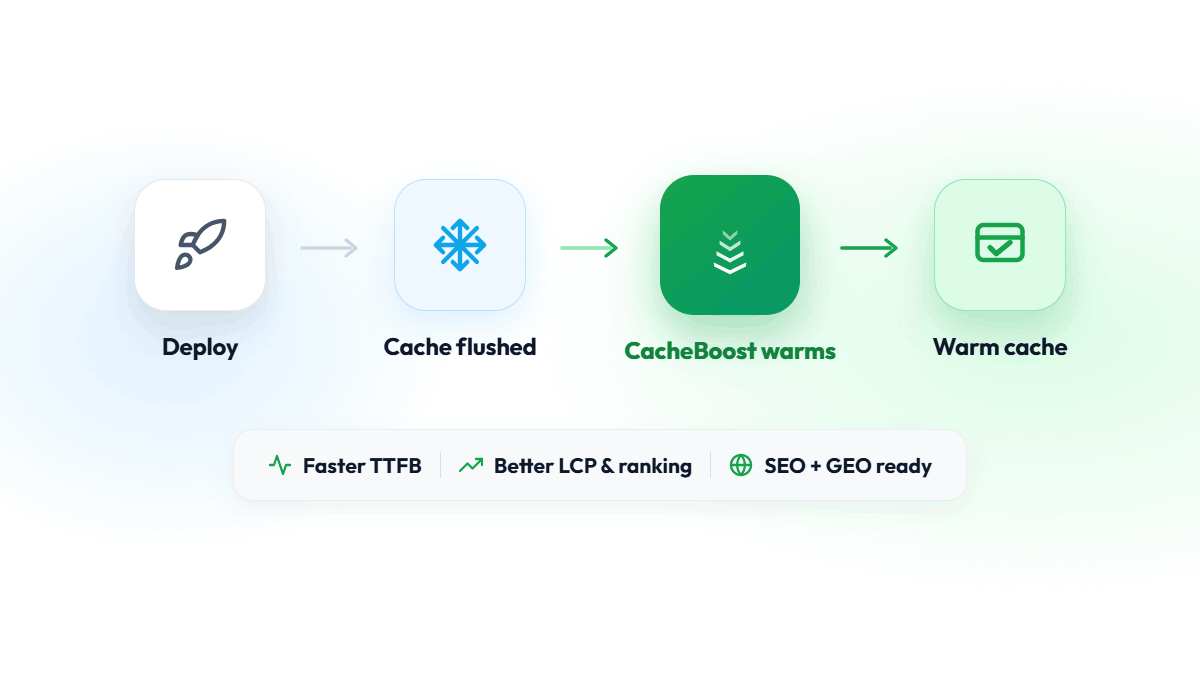
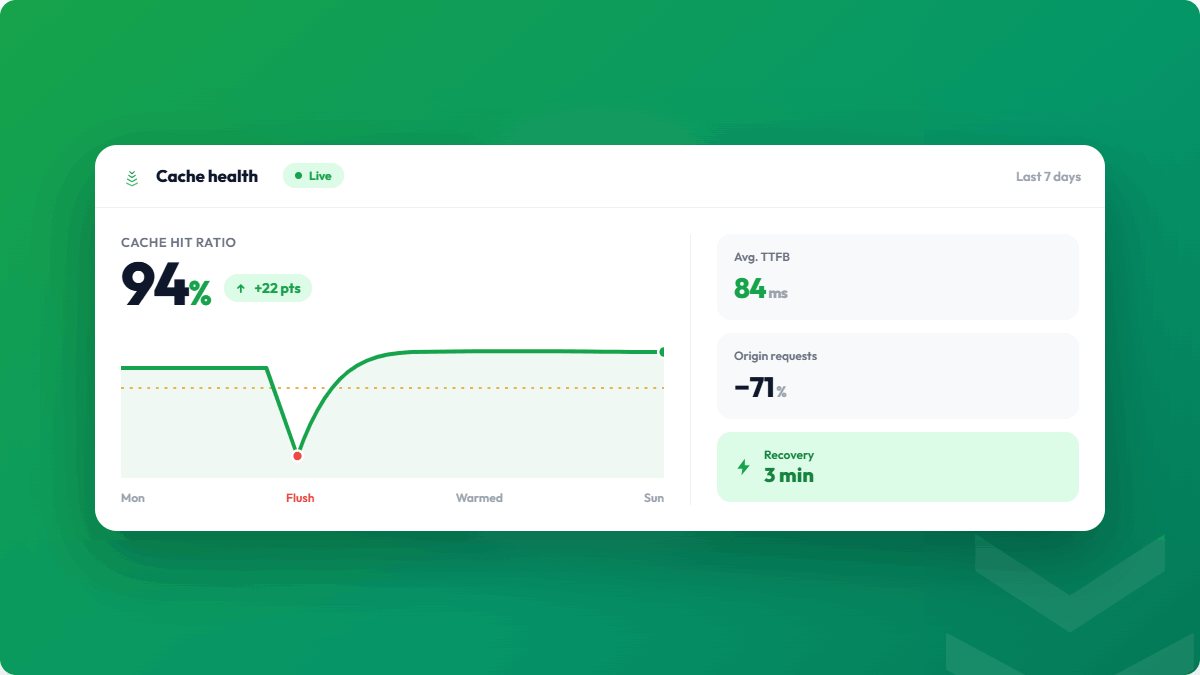
5. No warming: Even a perfect cache configuration produces a low hit ratio immediately after a flush. Without warming, hit ratio recovers slowly as organic traffic refills the cache. With warming, it recovers in minutes.
Building a cache health dashboard
For production sites, track hit ratio over time rather than spot-checking:
- Cloudflare Analytics (built-in)
- Varnish + Prometheus exporter + Grafana (self-hosted)
- CacheBoost run history (shows warming completion, which correlates with hit ratio recovery)
Set an alert when hit ratio drops below 70%: this usually indicates an unplanned cache flush or a configuration issue that needs investigation.